The next “flavor” of functions beyond linear functions is quadratic functions. In this section, we familiarize ourselves with their features and some related vocabulary.
A function \(f\) is a quadratic function if it has a formula in the form
\begin{equation*}
f(x) = ax^2 + bx + c
\end{equation*}
for some numbers \(a\text{,}\)\(b\text{,}\) and \(c\text{.}\) While \(b\) and \(c\) are allowed to be \(0\text{,}\) the number \(a\) must not be \(0\) (or else we would just have a linear function).
\(a\) is called the leading coefficient because it’s the coefficient on the term with the highest power of \(x\text{.}\) It is also called the curvature coefficient for reasons we will see later in this section.
Warning2.2.1.Formulas Are Not Always Written in the Same Order.
A quadratic function’s formula is not always written with its terms in the standard order \(ax^2+bx+c\text{,}\) and it’s possible for the \(x^2\)-term or the \(x\)-term to be “missing” because its coefficient is \(0\text{.}\) Before identifying \(a\text{,}\)\(b\text{,}\) and \(c\text{,}\) it helps to mentally (or actually) rewrite the formula in the order \(ax^2+bx+c\text{,}\) filling in a coefficient of \(0\) for any missing term.
The formula \(h(x)=-x^2+6\) has no \(x\)-term, so we may think of it as \(h(x)=-x^2+0x+6\text{.}\) And that reveals \(a=-1\text{,}\)\(b=0\text{,}\) and \(c=6\text{.}\)
The formula \(k(x)=9x^2-x\) has no constant term, so we may think of it as \(k(x)=9x^2-1x+0\text{.}\) Thus \(a=9\text{,}\)\(b=-1\text{,}\) and \(c=0\text{.}\)
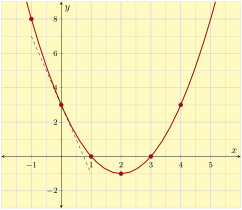
Just like with linear functions, we can make a table of input and output values for a quadratic function and plot those values as points in the \(xy\)-plane to see the shape of its graph. Let’s do this for the quadratic function given by \(f(x)=x^2-4x+3\text{.}\)
The graph appears to form a symmetric shape called a parabola. This parabola is opening upward, but other parabolas might be “upside down” and open downward. It turns out that whether a parabola opens upward or downward depends on whether its leading coefficient (aka curvature coeffficient) is positive or negative.
We can also see the constant term \(3\) from \(f\)’s formula appearing in the graph at the vertical intercept. The vertical intercept is the point \((0,3)\text{,}\) and that helps us understand why another name for the constant term is the intitial value.
The \(-4\) from the formula also makes an appearance in the graph. Since \(-4\) is the coefficient of \(x\text{,}\) it makes sense to think of \(-4\) as a slope. However in this graph, the slope of the parabola is different at different places. Right at the beginning, on the vertical intercept where the intial value is seen, that is where we can see slope \(-4\text{.}\) This explains why a term for \(b\) in a quadratic function is the initial slope.
There are more graphical features to observe in Figure 7. Every parabola has a vertex, which for a parabola, is a sort of extremity. For an upward opening parabola, the vertex is the lowest point on the graph. And its reversed for a downward opening parabola. In Figure 7, the vertex is at \((2,-1)\text{.}\) Traditionally, we use the letters \((h,k)\) for the coordinates of a vertex.
Also the graph in Figure 7 crosses the horizontal axis in two places. We could easily imagine a graph that was shifted so far upward that it crossed the horizontal axis nowhere. Or that touched the horizontal axis at precisly one place, thevertex. But this one crosses the horizotnal axis in two places. We can call these places horizontal intercepts. In this example, the horizontal intercepts are at \((1,0)\) and \((3,0)\text{.}\)
These points also tell us that \(f\) turns \(1\) into \(0\) and turns \(3\) into \(0\text{.}\) Numbers like this (\(1\) and \(3\)) that get turned into \(0\) by a function have a special name: roots. If you can pretend the graph is an abstract picture of a plant, the “roots” are where the plant emerges from the ground.
It’s important to become familiar with graphing apps. Sometimes they will do some of the math for you, which may feel like cheating. But familiarity with graphing apps is an important skill to develop.
Two well-known graphing apps are GeoGebra and Desmos. You can search for either on the internet, but the embedded examples below are using GeoGebra. All graphing apps will have the same core features.
Now the app “understands” the function \(f\text{.}\) On a new line, type \(f(0)\) and then enter/return. You will see the output from using \(0\) as input.
Another feature of a graphing app is the ability to quickly make a table of values for a function. Once you have entered a function’s formula, you can essentially tell the app a list of input numbers, and it will give you back all the corresponding outputs. In the app below:
Type \(f(x) = x^2 + 2x + 3\) and then enter/return.
Now you have to choose a starting \(x\)-value, an ending \(x\)-value, and the size of the steps to take in between. Try starting at \(x=-2\text{,}\) ending with \(x=3\text{,}\) and using steps of size \(0.5\text{.}\)
Of course, the main feature of a graphing app is to make graphs. In this next example, enter the formula for \(f(x) = x^2 + 2x + 3\text{,}\) and view its graph.
If you click back in the row that defined \(f\text{,}\) then “focus” is on that function. And the graphing app might reveal some special points for that function. Can you click on those points to confirm the coordinates of the vertex and the \(y\)-intercept?
It may be important to zoom out or zoom in, and slide the viewing window around. Practice this with your graph. Also, if you would like to zoom with respect to only one axis, you can do this by holding shift while click-and-dragging one of the axes. Try this too, so horizontally stretch or compress the graph.
Suppose \(f(x)=x^2-8x+15\text{.}\) Then we can write the formula in factored form: \(f(x)=(x-3)(x-5)\text{.}\) Now we can clearly see a few input numbers that would “zero out” the formula. Using \(x=3\) would zero out the first factor, and using \(x=5\) would zero out the second factor.
So simply by looking at the factored formula \(f(x)=(x-3)(x-5)\text{,}\) we see that \(f(3)=0\) and \(f(5)=0\text{.}\) This means that \(3\) and \(5\) are the roots of this function. And it means that \((3,0)\) and \((5,0)\) are the horizontal intercepts of its graph.
The function formula factors as \(g(x)=3(x+5)(x-4)\text{.}\) So we can see that the roots are \(-5\) and \(4\text{.}\) These are the numbers that “zero out” the formula by canceling what we see in the formula. And the horizontal intercepts are \((-5,0)\) and \((4,0)\text{.}\)
The factored form of a quadratic function is \(f(x)=a(x-r)(x-s)\) where \(a\) still means the curvature coefficient, and the roots of the function are \(r\) and \(s\text{.}\)
If we have the factored form of a quadratic function, then we know where the two roots are. And a paraobala is a symmetric shape. This means the vertex’s first coordinate (which we traditionally call \(h\)) is right in the middle of the two roots. That is, \(h\) is the average of the two roots. We can write this as a formula:
\begin{equation*}
h = \frac{r+s}{2}
\end{equation*}
And then it’s a quick follow-up to find \(k\text{,}\) because \(k=f(h)\)
What if we have a standard form formula for a quadratic function, and we wish to locate the vetex, but we don’t want to take the time to factor it? There is a short formula we can memorize for this. To work out that formula, take the generic factored form and multiply it out:
So the initial slope (which we have called \(b\)) is equal to \(-a(r+s)\text{.}\) But we have recently learned that \(h=\frac{r+s}{2}\text{.}\) This is the same as the equation \(2h=r+s\text{.}\) So we can write:
This formula quickly gives us the value of \(h\) using the standard form coefficients \(a\) and \(b\text{.}\) And as earlier, we can find \(k\) using \(k=f(h)\text{.}\)
Since \(h=-\frac{b}{2a}\text{,}\) we have \(h=-\frac{-4}{2(3)}=\frac23\text{.}\) And then
\begin{align*}
k \amp=f\mathopen{}\left(\frac23\right)\mathclose{}\\
k \amp=3\left(\frac23\right)^2-4\left(\frac23\right)+5\\
k \amp=3\left(\frac49\right)-\frac83+5\\
k \amp=\frac43-\frac83+5\\
k \amp=-\frac43+5\\
k \amp=\frac{11}3
\end{align*}
So the vertex is at \(\left(\frac23,\frac{11}{3}\right)\text{.}\)
Since \(h=-\frac{b}{2a}\text{,}\) we have \(h=-\frac{8}{2(1/2)}=-8\text{.}\) And then
\begin{equation*}
\begin{aligned}
k \amp=f(-8)\\
k \amp=\frac12(-8)^2+8(-8)+2\\
k \amp=\frac12(64)-64+2\\
k \amp=32-64+2\\
k \amp=-30
\end{aligned}
\end{equation*}
We can see (just by looking at this formula) that \(f(4)=5\text{.}\) Using \(x=4\) would “zero out” the first chunk of the formula and leave only \(5\) remaining. So a point on the graph is \((4,5)\text{.}\)
The output \(5\) is the lowest possible output for this function, because \(2(x-4)^2\) could never be negative. Whatever input is used, \(2(x-4)^2 + 5\) can never be less than \(5\text{.}\) So the point \((4,5)\) is actually this function’s vertex.
The example we just studied has formula in the form \(f(x)=a(x-h)^2+k\text{.}\) We call this vertex form. When a quadratic funciton formula is in vertex form, we can see the coordinates of the vertex just by looking at the formula.
The formula shows us that \(h=-7\text{.}\) (This is what is needed to “zero out” the first chunk of the formula.) And we also see that \(3\) would remain. So the vertex is at \((-7,3)\text{.}\)
That is, you need to find which \(x\)-values make the equation true. Later we will study how to do this with only pencil and paper. But having just learned about graphing apps, let’s explore now how a graphing app can be used for this purpose.
You probably do not have a good viewing window yet. Use the zoom and drag tools until you can see all of the places where the two curves cross each other. In this example, there are two such places.
We need the exact coordinates of the places where the two curves cross eachother. In GeoGebra, a reliable way to do this is to use the “Tools” menu and select the “Intersect” tool. Then click nearby each crossing. Then return to the “Algebra” menu and you will see the coordinates. You should see \((1,-3)\) and \((-3,11)\text{.}\)
We found the intersections are at \((1,-3)\) and \((-3,11)\text{.}\) How does this help us solve the original equation \(x^2+4x-8=2x-5\text{?}\) Apparently, if \(x=1\text{,}\) then left side and the right side work out to be the same thing (namely, \(-3\text{,}\) but that doesn’t matter.) So \(x=1\) is a solution. And likewise \(x=-3\) makes both sides work out to the same thing (\(-11\)). So \(x=-3\) is another solution.
Use a graphing app to solve \(2x^2-3x+1=x^2-5x+1\text{.}\) Make sure you follow a process that involves making two curves and looking at their intersection points.
Each form of a quadratic function formula tells you something about the graph merely by looking at the formula (and not doing any calculations). What graphical features does each form tell you?
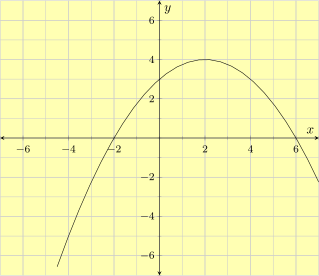
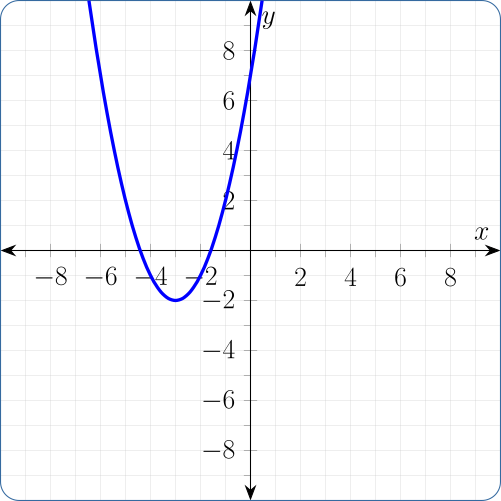
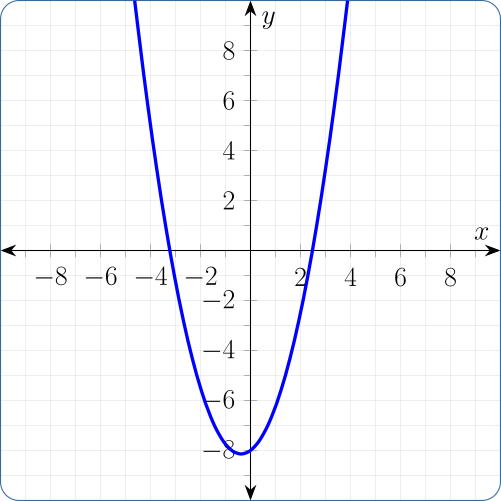
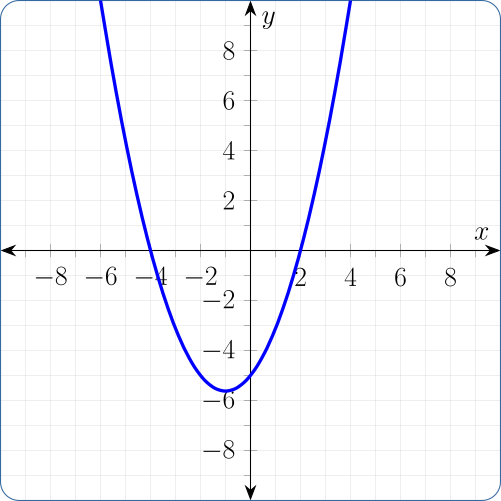
The graph of \(y={{\frac{5}{8}}x^{2}+{\frac{5}{4}}x-5}\) is given. Draw a point that represents the vertex. Draw a line that represents the initial slope.
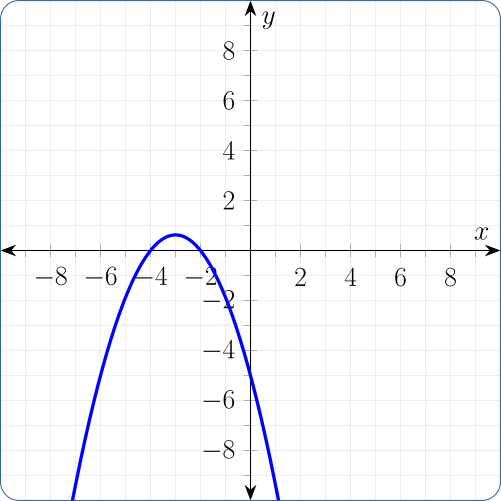
The graph of \(y={-{\frac{5}{8}}x^{2}-{\frac{15}{4}}x-5}\) is given. Draw a point that represents the vertex. Draw a line that represents the initial slope.
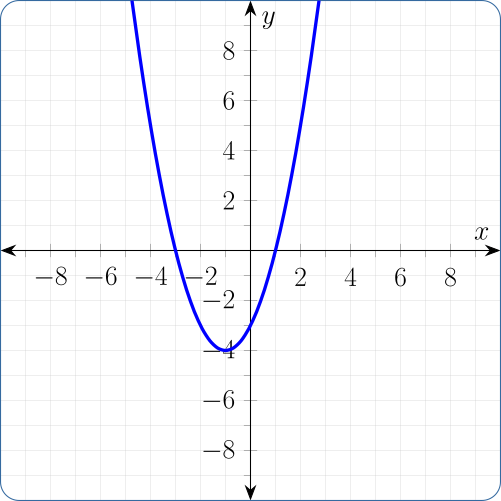
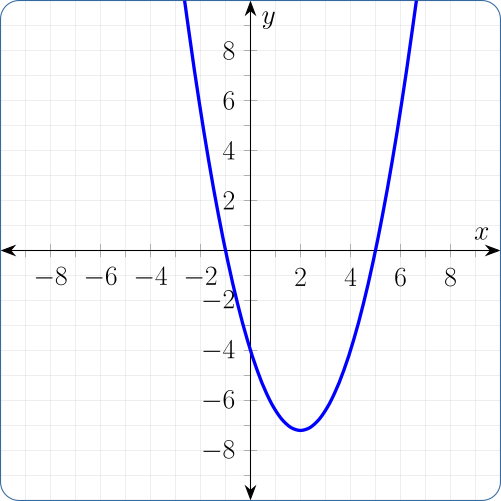
The graph of \(y={{\frac{4}{5}}x^{2}-{\frac{16}{5}}x-4}\) is given. Draw a point that represents the vertex. Draw a line that represents the initial slope.
Use a graphing app to solve the equation graphically. Make sure you follow a process that involves making two curves and looking at their intersection points.
You are planning to build a rectangular sheep enclosure next to one wall of an enormous barn. There will be no need to build any fencing alongside the barn, so you only need to build fencing on three sides. You have a total of \(390\) feet of fencing to use. Find the dimensions of the pen such that you can enclose the maximum possible area.
A farmer plans to build two adjacent rectangular enclosuresusing \(410\) feet of fencing. The two rectangles will share one side in common so that there will be five fencing walls in total. Find the maximum total area that can be possibly be enclosed.